
22.10.2026
ResQ Club’s climate impact in 2025: our footprint and the estimated emissions avoided through rescued items

In short
- Our carbon footprint in 2025 was 65,2 t CO₂e (market-based), 6% more than in 2024 (61,7 t CO₂e). We had no direct Scope 1 emissions. Scope 2 emissions fell by 13%, while Scope 3 emissions grew by 19%, mainly due to business travel and purchases.
- Items rescued through ResQ avoided an estimated 3 722 t CO₂e in 2025 (3 686 t CO₂e in 2024). This is our carbon handprint, on average 1 007 g CO₂e per rescued item.
- Both were calculated by the independent climate consultancy NGS Finland: the footprint following the GHG Protocol, the handprint using life cycle assessment (LCA). The results have not been externally verified.
- The two figures are reported separately. Estimated avoided emissions are not subtracted from our own footprint and are not carbon offsets.
Before our 2026 climate results are ready, it’s high time to look back at 2025. This year we’re publishing our carbon footprint and carbon handprint together, in one post.
PART 1
ResQ’s carbon footprint: the emissions from running our service
What is a carbon footprint?
A carbon footprint is the total greenhouse gas emissions caused by a company’s operations and value chain. Under the GHG Protocol, the most widely used international standard for emissions accounting, emissions are divided into three scopes:
- Scope 1: direct emissions, such as fuel burned in company vehicles or on company premises
- Scope 2: emissions from purchased energy, such as office electricity and heating
- Scope 3: all other indirect emissions in the value chain, such as purchased services, IT, travel and commuting
Results for 2025
In 2025, ResQ Club’s market-based greenhouse gas emissions totalled 65,2 tonnes of CO₂ equivalent (t CO₂e). Using the location-based method, which applies average grid emission factors, the total was 54,1 t CO₂e.
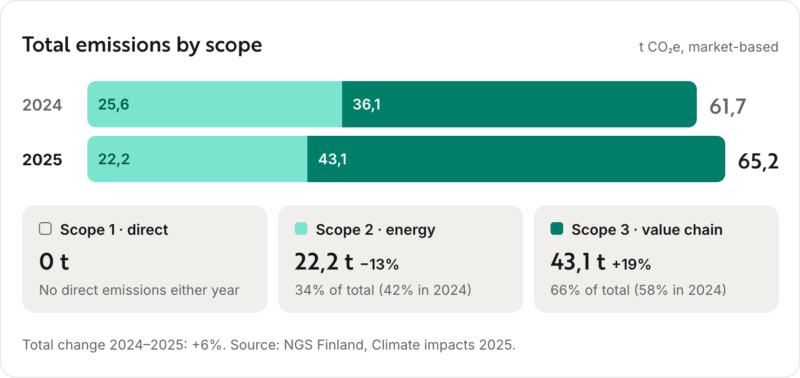
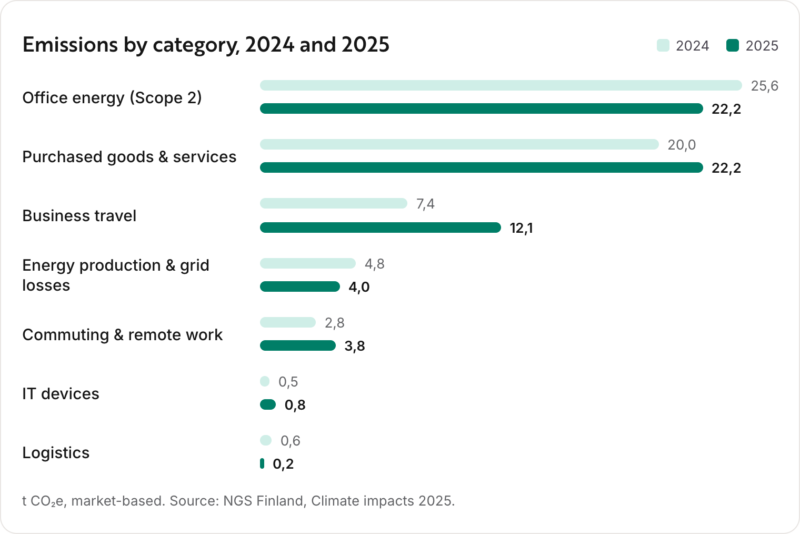
Scope 3 made up 66% of our emissions and Scope 2 the remaining 34%. In 2024 the split was 58% and 42%. The largest single categories were purchased goods and services (22,2 t, of which IT services 17,4 t), office energy (22,2 t) and business travel (12,1 t, of which flights 7,6 t).
What changed from 2024?
- Energy emissions decreased. Emissions from office electricity fell by 21% and from heating by 4%, as total energy use decreased and part of the energy came from renewable sources. Our office in Germany uses renewable electricity and heating.
- Purchases increased by 11%, mainly due to larger procurement volumes and some higher-emission items such as tote bags. This category also includes catering for team events, which varies from year to year.
- Business travel grew from 7,4 to 12,1 t CO₂e, driven by more air travel related to opening the German market, including trade fairs.
- Commuting and remote work grew from 2,8 to 3,8 t CO₂e, likely due to a larger team and more frequent data collection from employees.
- Logistics emissions fell by 63%, largely because we now use supplier-specific emission data for deliveries.
How does it compare?
To follow whether our emissions grow at the same pace as our business, we track carbon intensity: emissions in relation to turnover, personnel and rescued items. In 2025, all three intensity figures increased, which means our emissions grew slightly faster than our turnover and the number of items rescued.

Our emission profile also differs from a typical company. Usually Scope 3 accounts for the vast majority, often more than 90%, of a company’s emissions. At ResQ, office energy is still a third of the total, which is why energy choices and travel are the areas where our own actions have the most effect.
How was it calculated?
This is the third year our emissions have been calculated by NGS Finland. The calculation follows the GHG Protocol Corporate Standard and the Scope 3 Standard, and covers the whole company: our offices in Finland, Estonia and Germany, and remote workers in Sweden, for 1 January to 31 December 2025.
- Data is collected quarterly from our systems and from employees. Energy emissions are calculated at year-end once full consumption data is available.
- Scope 2 is reported both market-based (the energy contracts we have chosen) and location-based (grid averages).
- Supplier-specific or manufacturer data is used where available, and spend-based averages where it is not.
- Flight emissions include a radiative forcing factor of 3, since emissions released at high altitude have a stronger climate effect.
- Waste and wastewater, and the energy used by the ResQ app on customers’ phones, were assessed as immaterial and left out.
- The results have not been externally verified.
PART 2
Estimated emissions avoided through ResQ: our carbon handprint
What is a carbon handprint?
A carbon handprint describes the emission reduction that happens in someone else’s activities when a product or service replaces a baseline solution. In ResQ’s case, it estimates the greenhouse gas emissions avoided when surplus meals, groceries, flowers and other goods are bought and used through ResQ instead of being thrown away.
Every wasted item carries the emissions from producing, processing, transporting and preparing it. When a restaurant meal is wasted, a new one often has to be cooked to replace it. Rescuing the item is estimated to avoid part of those emissions, as well as the emissions from handling the waste.
Results for 2025
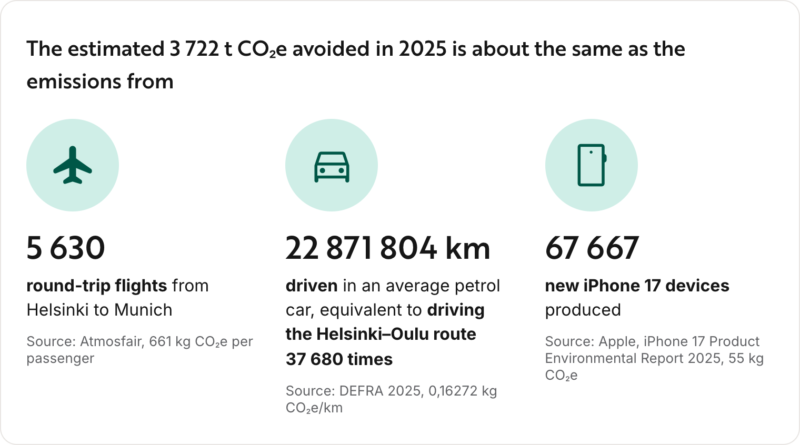
In 2025, items rescued through ResQ avoided an estimated 3 721,7 t CO₂e, compared with 3 686,4 t CO₂e in 2024 (+1%). On average, that is 1 007 g CO₂e per rescued item (981 g in 2024).
The per-item figure rose mainly because the mix of meals changed: meat and seafood offers made up a larger share, and meat-free offers a smaller share, than in 2024. The average covers all product types sold through ResQ, from meals and grocery bags to flowers, wholesale products and cosmetics. Each type has its own calculation, since the emissions avoided by rescuing a meal are very different from those of a bouquet of flowers.
To put the estimated avoided emissions into perspective:
How was it calculated?
NGS Finland used life cycle assessment (LCA), with the same method as in our first handprint assessment for 2024, which followed the VTT Carbon handprint guide V. 2.0. Two scenarios are compared:

- Only what differs between the scenarios is counted. For example, preparing the original meal happens in both cases, so it doesn’t affect the comparison.
- Estimated avoided emissions (3 880,0 t CO₂e) include waste management and waste transport, and the ingredients, cooking and transport of replacement meals. Added emissions in the ResQ scenario, mainly takeaway packaging (158,2 t CO₂e), are deducted from them.
System boundaries
The assessment covers all stages from raw material production and purchases by stores, cafés, restaurants and wholesalers up to the point of sale, where items are handed to customers. This includes energy used in storage and food preparation, and the different takeaway packaging options.
Excluded are the energy customers use for storing or heating items, the waste management of the takeaway packaging, and environmental impacts other than greenhouse gas emissions.
Calculation methods
The calculations follow established LCA and emission calculation practices:
- Waste amounts: based on actual item counts and estimated item weights
- Restaurant meals: based on fresh ingredient purchases, with separate emission factors for each protein category, such as meat-free, chicken, beef, pork, fish and seafood. Two minor protein categories, lamb and turkey, use simplified calculations due to limited data.
- Waste management: emission factors for composting biowaste and incinerating mixed waste with energy recovery (DEFRA 2025)
- Transport: industry-standard default distances and emission factors for food, packaging and waste transport (DEFRA 2025)
- Energy: energy used for cooking meals, calculated with Finnish electricity grid averages (Syke 2025, Fingrid 2025)
- Packaging: based on the average number of items per order and emission factors for cardboard and plastic packaging materials
Assumptions
Not every detail can be known, so some assumptions were needed, drawing on scientific databases, ResQ’s own data and practical experience. Average item and packaging weights, how packaging is used in different scenarios, typical transport distances and the need for refrigerated deliveries were all estimated using conservative values, to avoid overstating the emissions avoided.
The results have not been externally verified.
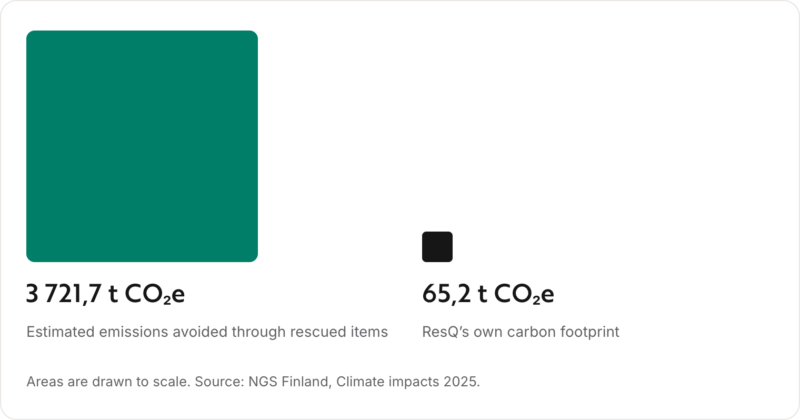
Footprint and handprint side by side
Per rescued item, running ResQ caused 17,6 g CO₂e of emissions in 2025, while the item itself avoided an estimated 1 007 g CO₂e in the venues’ and customers’ value chain.
How to read these numbers
Our footprint and our handprint are two separate indicators calculated with different methods. The avoided emissions happen in the value chains of our partner venues and customers, so they do not reduce ResQ’s own emissions and we don’t subtract them from our footprint. They are not carbon offsets, and we don’t use them to claim that ResQ or the items sold through it are climate neutral. What they show is the estimated difference it makes when surplus is used instead of wasted.
Questions?
The full climate impact report is available on request. If you’d like to know more about the results or the methodology, get in touch.
You can also read our earlier posts on the 2024 carbon footprint and the 2024 carbon handprint.
Contact:
Elsa Ahlfors
Marketing & Sustainability Manager
elsa@resq-club.com

22.10.2026In Sustainability
Share this article
Lataa ResQ Club -sovellus
Skannaa QR-koodi ladataksesi sovelluksen

Anna ylijäämätuotteille uusi mahdollisuus, ja säästä samalla rahaa ja luontoa.
Lataa ResQ Club
-kumppanisovellus
Skannaa QR-koodi ladataksesi sovelluksen
Kasvata myyntiä vähentämällä hävikkiä. Miksi heittää hyviä tuotteita pois? Muuta myymättömät tuotteet
tuloiksi ja houkuttele samalla uusia asiakkaita.
Get the ResQ Club partner app
Scan the QR code to get the app
Unlock New Revenue from Unsold Goods. Why waste quality goods? Turn surplus into profit and attract new customers.
Get the ResQ Club App
Scan the QR code to get the app
Save money and help reduce waste with ResQ Club. Find delicious food and more in our app.